
Type “Safe Withdrawal Rates in Retirement” into google and you will be bombarded with multiple explanations of SWR and the 4% rule in all its different guises whether that be mathematical theorists or evangelical bloggers, most lean towards a positive conclusion. We also need to connect this to my can you retire at 40 blog post where we talked about the “25 times your annual expenses rule”.
I’m am not a mathematician and even after 30 years as an accountant I still believe I’ve been bluffing my way through (this article on feeling a fraud at work could have been written about me). But I do like statistics and correlations so I’m going to tell you why you should be worried. However, don’t fret because I’m also going to show you some pictures which will make the story digestible.
The fact is that as you think about how you build your stack and how you draw down in retirement there are very few numbers you need to worry about. In fact there are only two (investment return and inflation) and ultimately maybe only one (the net investment return i.e. your investment return after inflation).
A simple illustration
We’ll start with a simple illustration to get the ball rolling.
Let’s assume annual expenses of 20,000 which, using the logic of 25 times your annual expenses would mean a retirement pot of 500,000. For the purpose of simplicity we’ll also assume that draw down is linear i.e. expenses do not decline as we get older.
- In example one we will assume a gross investment return of 3% per annum and zero inflation;
- In example two we will assume a gross investment return of 6% per annum and 3% inflation.
Do you see what I did there? In BOTH cases our net investment return is 3% per annum.
We’ve mapped the outcome in the following charts:
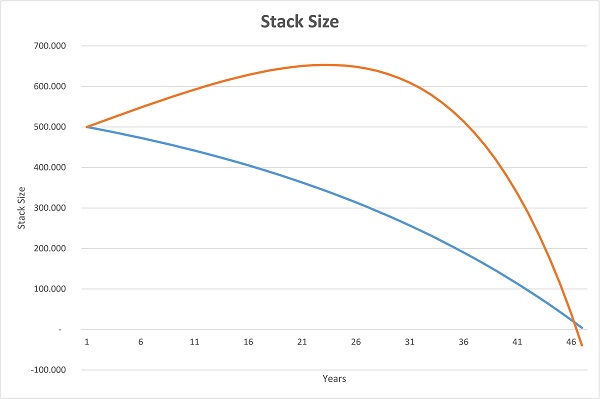
The first chart shows what happens to our stack over time and the second chart shows how many years’ expenses we have at the end of each year.
What this illustrates is that in the first example our stack gradually declines as our annual expenses are higher than our investment returns. The second example is more complicated as it shows that initially our 500,000 pot of money actually increases as the investment return is higher than our annual expenses but eventually inflation pushes our living expenses up and our stack begins to decline.
Now let’s talk about the witchcraft.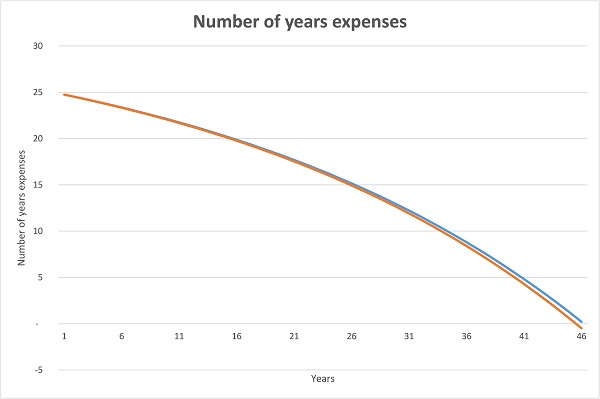
In BOTH cases our money runs out at the same time and in BOTH cases our year end pot represents the same multiple of our expected living expenses (chart 2). Spooky.
These are theoretical examples but there could be a couple of interesting outcomes.
Firstly, as our stack increases (in example two) we may be lulled into a false sense of security so there may be a temptation to splurge on a new car / big holiday etc. That might be a mistake as if we can’t retain the same net investment return going forward we might run out of money sooner than we think.
Secondly, if the correlation between inflation and investment returns were to change our retirement plan might be materially disrupted…
…and that is why we might need to be worried
“That all looks very sensible” you are thinking, so why should you be worried? Well, as we’ve said it’s all about the net investment return. SWR theorists love to talk about “success rates” but all are based on patterns of historical data. Indeed they have converted that historical data into a couple of very popular calculators, for example here and here. But to quote the common caveat “historical performance is no guarantee of future returns”. So let’s delve just a little deeper into the figures which support our most important number, the net investment return.
Over here at EarlyRetireFree we like to keep things simple and you’ll hear a lot of people talk about ‘risk free returns’ which is typically defined as “the theoretical rate of return of an investment with no risk of financial loss, over a given period of time” which generally corresponds with the return on government debt (although of course that depends on which government you are talking about ;-)). We’re not going to talk about that but what we are going to talk about is the relationship between interest rates and inflation.
Over the last 100 years (we like simple round sums!) the average official rate of interest (i.e. the base rate – and I’m using a UK reference point here) was 5.39% and the average over the last 25 years was approximately 5.9% so not too dissimilar. However, break those figures down a little further and we see that since May 09 (roughly 8 years) the average was under 0.5%. Excluding that period of exceptionally low rates the average over the last 25 years (i.e. since 1982) was just under 8% (which is similar to the average over the last 50 years).
 Now comes the funky stuff. Over that same 25 year period, inflation was on average 3.2% (or 3% excluding the period since May 09). Since May 09 the average has been 2.2%.
What those figures mean is that if you were to take the historical average (up to May 09) and just invest at the average base rate (a relatively risk free rate) you would have grown your money by on average just under 5% per annum (i.e. the average interest rate of 8% less the average inflation of 3.2%) which was pretty easy to achieve.
Since May 09 the relationship has inverted (meaning inflation is greater than interest rates).
That’s a lot of numbers so why is it important?
- For those who were building their stack over the years up until May 2009, it was relatively easy to achieve a decent return above inflation and, now having built that stack, they are benefitting as inflation is low so not driving their annual living costs up and therefore not eating away at that stack through inflation.
- For those who are still building their stack, the negative relationship between inflation and interest means that achieving a rate of return materially above inflation requires taking on significantly more risk than it did historically.
Of course there are many out there who will say that interest rates will over time return to their long run averages but I suspect that is more in hope that real belief. Indeed with an increase in the number of companies making offers to buy people out from defined benefit pension schemes there may be even a suggestion that things could get worse. In addition, we all know that high house prices have significantly increased the need to take on more debt and consumer credit is at record levels so the prospect of any significant interest rates moves seems unlikely, certainly over the next 5-10 years.
So that’s the bad news, what can we do about it?
Here are my 5 top tips for those looking to build their stack and be confident in their Safe Withdrawal Rate:
1. Pensions and inflation linked returns are your friend
Most of us have some committed pension arrangements that will kick in over time either from employers or the government and whilst we can’t necessarily rely on those completely, they should form the bedrock of our retirement withdrawal planning (particularly those with a cost of living adjustment). Make sure you know exactly when and how much those pensions will pay out.
2. You will need to take on more risk but diversity can help avoid the sleepless nights
Putting your money in a bank account generating 1-2% interest might feel ‘safe’ but with average inflation running between 2-3% your money is being eaten away by inflation. To build for retirement and then make sure you can continue to generate the returns to meet your retirement needs you’ll need to think about a mixture of investments by type (equities, bonds, property, P2P) and region (developed / emerging market) that offer the prospect of higher returns but sufficient diversity that you don’t feel over exposed to one particular asset class.
3. There’s no such thing as a passive approach to investing
There are many proponents of passive investing funds out there. But investing in passive funds is not the same as having a passive approach to investing. Individuals need to take an interest in their portfolio and understand the purpose of each holding. If you’re like me, you wouldn’t try and make performance improvements to your car’s engine as you probably know very little about how your car works. So why would you think you don’t need a professional approach to investing (which may include paying a professional investment advisor). Which leads on to my next point…
4. Get yourself a spreadsheet!
It doesn’t have to be too complicated and mine has three sheets.
- Sheet 1. My investments (cost, current market value, expected income yield) including cash balances.
- Sheet 2. Expenses
- Sheet 3. Income and expenses mapped monthly over 40 years. I use simple assumptions for inflation and gross investment return to project my net investment return and can then flex the net to see where my pinch points are.
5. Have a contingency plan
You don’t have to put your early retirement plans on hold but think about what you might do if your plans don’t work out. Can you temporarily reduce your expenses or go back to work to generate some income if your returns don’t look like they are going to meet your needs? Can you underpin part of your retirement expenses with an annuity or other income certain product?
Conclusion
Using historical models to predict Safe Withdrawal Rates may be flawed if we have now entered an extended period of low interest rates and returns.
If that proves to be the case then prospective early retirees will be left with two choices. Either take on more risk to achieve the same returns as were enjoyed historically or plan for a lower Withdrawal Rate to reduce the risk of running out of money.
As usual DYOR.
2 thoughts on “Safe Withdrawal Rates (SWR) and why you should be worried”
Nice write up. Interesting to see someone not focusing on the US for their projected returns.
And you are right, if shit hits the fan, you can always go back and work. Flexibility is key!
Interesting article!
Would it be possible for you to perhaps attach a sanitised version of your spreadsheet?